The Economics of Shipping's Climate Choice
What does climate inaction cost — and compared to what?
In October 2025, an extraordinary session of the IMO's Marine Environment Protection Committee voted 57 to 49 to delay adoption of the Net-Zero Framework by one year. The NZF, a global fuel standard and emissions pricing mechanism for international shipping, had been approved in principle six months earlier at MEPC 83. It promised to be the first binding climate regulation for any global industry.
The NZF had broad support — 63 countries voted to approve the draft text at MEPC 83 in April 2025. By October, the political landscape had shifted. The United States, which has shown disdain for multilateral climate commitments under the current administration, arrived at MEPC ES.2 in active opposition and, alongside Saudi Arabia, applied considerable diplomatic pressure on countries that had previously backed the Framework. States that might otherwise have supported adoption were left facing not just a complex regulatory package with important design details still undefined, but a geopolitical environment in which voting yes carried costs beyond the IMO chamber.
The motion to adjourn carried 57 to 49. The publicly stated rationale centered not just on the NZF's compliance costs per se, but on uncertainty. Uncertainty about how compliance mechanisms would function in practice, how Fund revenue would be distributed, and what the realized economic burden would be for individual countries. Those are legitimate questions. But they are answerable questions, and leaving them unanswered has its own price.
A paper published in Nature in March 2026 makes it possible to quantify that price with new precision. Burke, Zahid, Diffenbaugh, and Hsiang developed an empirical framework that quantifies climate damage at the country level. That is, not from integrated assessment models, but from observed historical relationships between temperature variation and economic output. Their approach captures damage channels that models often miss: labor productivity loss, agricultural disruption, institutional stress, and the compounding effects of heat on long-run GDP growth. The resulting social cost of carbon (SCC): approximately $1,013 per tonne at a 2% discount rate. Multiples higher than previous science-based estimates.
This analysis applies their country-level damage data to international shipping's emissions trajectory, compares it against the NZF's compliance costs, and asks: for each country, is the Net-Zero Framework worth it?
The cost of doing nothing
The Shipping Climate Costs tool quantifies the annualized economic damage from business-as-usual shipping emissions, attributed to 163 countries as a percentage of GDP. It computes the present value of cumulative damages over 2028–2050, adds a terminal value for post-2050 emissions, and converts the total to an equivalent annual cost. That is, the constant yearly burden whose present value equals the full damage stream.
At Burke et al.'s empirical damage estimate, the annual cost of doing nothing about shipping emissions is $2.6 trillion. That figure is not a single year's damage from a single year's emissions. It is the annualized present value of the entire future damage stream generated by continued business-as-usual shipping, including the damages that compound and persist for decades after each tonne is emitted. This is how the social cost of carbon works: it prices the entire future consequence of each tonne, not just the year it enters the atmosphere.
The distribution is sharply uneven. The United States bears the largest absolute burden, over $500 billion per year in annualized climate damage from shipping emissions alone, driven by the sheer size of its economy and its exposure to heat-related productivity loss, extreme weather, and agricultural disruption. China, India, and Brazil follow. At lower SCC estimates — $230 (Rennert/EPA) or $280 (Moore et al. expert consensus) — the global total falls proportionally, but the pattern remains: tropical and developing economies bear disproportionate costs relative to their GDP.
The African continent illustrates this clearly. Across the 49 African Union member states in the tool, shipping climate inaction costs 2.88% of GDP or around $215 billion per year at the Burke et al. estimate. For many African economies, the climate damage from shipping emissions alone exceeds their entire public health or infrastructure budgets as a share of GDP.
Then there are the countries for which GDP-based damage functions are structurally inadequate. Small Island Developing States are among the most vocal proponents of shipping decarbonization, yet they receive negligible damage weight under any country-level SCC framework. This is not a calibration error, it is a fundamental limitation. The total inundation of a small island nation registers as a rounding error in the global damage total. GDP cannot represent the difference between losing 5% of output and losing an entire country. The SIDS case for the NZF is existential, not economic, and no interactive tool built on damage functions can fully capture it.
The cost of doing something
The NZF has real costs. Ships that exceed greenhouse gas intensity targets must purchase remedial and/or surplus units; the resulting compliance burden flows through to freight rates, import prices, and GDP. The magnitude depends on fleet behavior, fuel prices, and the NZF's internal design choices. Notably, how Fund revenue is split between rewards and disbursements, which countries are eligible, and how efficiently funds translate to GDP benefit.
The compliance cost estimates in this analysis are derived from Fourth Tack's own modeling, which builds on the IMO's Comprehensive Impact Assessment (MEPC 82/INF.8/Add.2, Scenario 24) and applies the same cumulative NPV framework used on the damage side. The model uses mid-range assumptions for NZF design parameters intended to represent a reasonable estimate for where compliance costs might land across the range of configurations still under negotiation. At delay zero, annualized global NZF compliance costs total approximately $453 billion per year.
The NZF's Fund mechanism captures a relatively small portion of overall compliance costs and redistributes it to developing economies, reducing, though not eliminating, their net burden. At current design parameters, the Fund's disbursement channel is modest: roughly half of total Fund revenue, translating to about 3% of gross compliance costs on an annualized basis. For African economies, this means the NZF's economic footprint is primarily determined by two forces: the compliance cost passed through via higher shipping prices, and the residual climate damage from emissions the NZF does not eliminate. Under the NZF, the African Union's total economic burden drops from 2.88% of GDP to 0.81% — a reduction of more than two-thirds driven mainly by avoided climate damage rather than Fund redistribution.
But at the level of the global comparison, the design details do not change the fundamental calculus. No plausible configuration of the NZF moves the global break-even SCC by more than a modest amount. The NZF in any form is better than doing nothing at any science-based damage estimate.
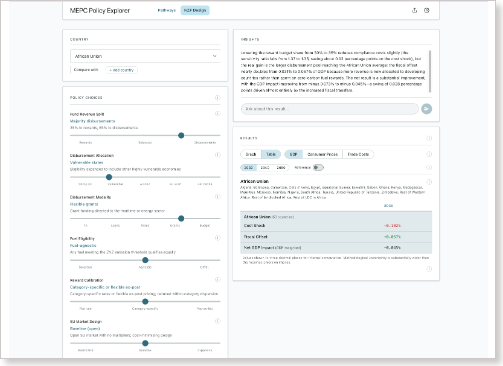
For those interested in exploring how design choices affect specific countries, the MEPC Policy Explorer models six policy proposals currently on the table and lets users adjust Fund parameters to see the country-level consequences.
The comparison
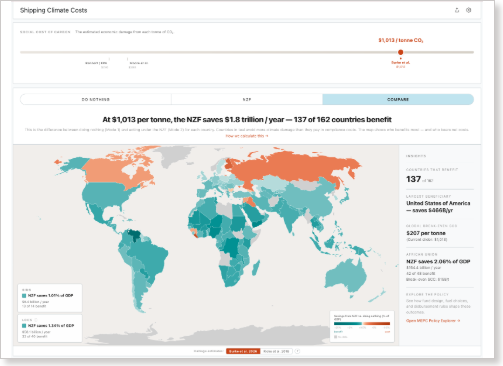
The global break-even social cost of carbon — the point at which NZF compliance costs exactly equal avoided climate damages — is $207 per tonne. Below that threshold, inaction is cheaper in aggregate. Above it, the NZF pays for itself.
Every major published SCC estimate exceeds this threshold. The EPA's central figure is $230. The expert consensus estimate from Moore et al. (2024) is $280. Burke et al.'s empirical estimate is $1,013, nearly five times the break-even. At Burke's estimate, 137 of 162 NZF-eligible countries are better off under the Framework than under inaction. The African Union's collective break-even is $158 per tonne — below even the most conservative credible estimate.
India and Brazil illustrate why the NZF is an easy case for many large developing economies. Both have substantial shares of global climate damage but NZF compliance costs that are modest relative to the size of their economies. Their break-even SCCs are well below any credible modern estimate ($107 and $129 for Brazil and India respectively), meaning the NZF pays for itself for both countries at any plausible valuation of climate damage. The same is true for most of sub-Saharan Africa, South and Southeast Asia, and Latin America.
The countries that are not better off are predominantly cold-climate economies with near-zero damage weights and high trade exposure: Finland, Russia, Estonia, Canada. They are the exceptions that prove the pattern.
The question, then, is not whether the NZF is worth it. At any credible damage estimate, it is. The question is how to design it so the benefits reach the countries that need them most, and whether the political will exists to act on the evidence.
A few weeks from now, delegates will reconvene at ISWG-GHG 21 and MEPC 84 to take up that question. The economics are clear. The decision is political
Explore the evidence
Both tools are interactive and fully transparent. Every assumption is documented, every parameter is user-adjustable, and a complete methodology annex is available.
Shipping Climate Costs — look up the cost of climate inaction for any country, adjust the SCC, and compare against the NZF. 163 countries, three modes (Do Nothing / NZF / Compare), Burke and Ricke damage weight toggle.
MEPC Policy Explorer — compare six IMO policy proposals and model how NZF design choices (Fund revenue split, eligibility rules, disbursement efficiency) affect economic outcomes for specific countries.